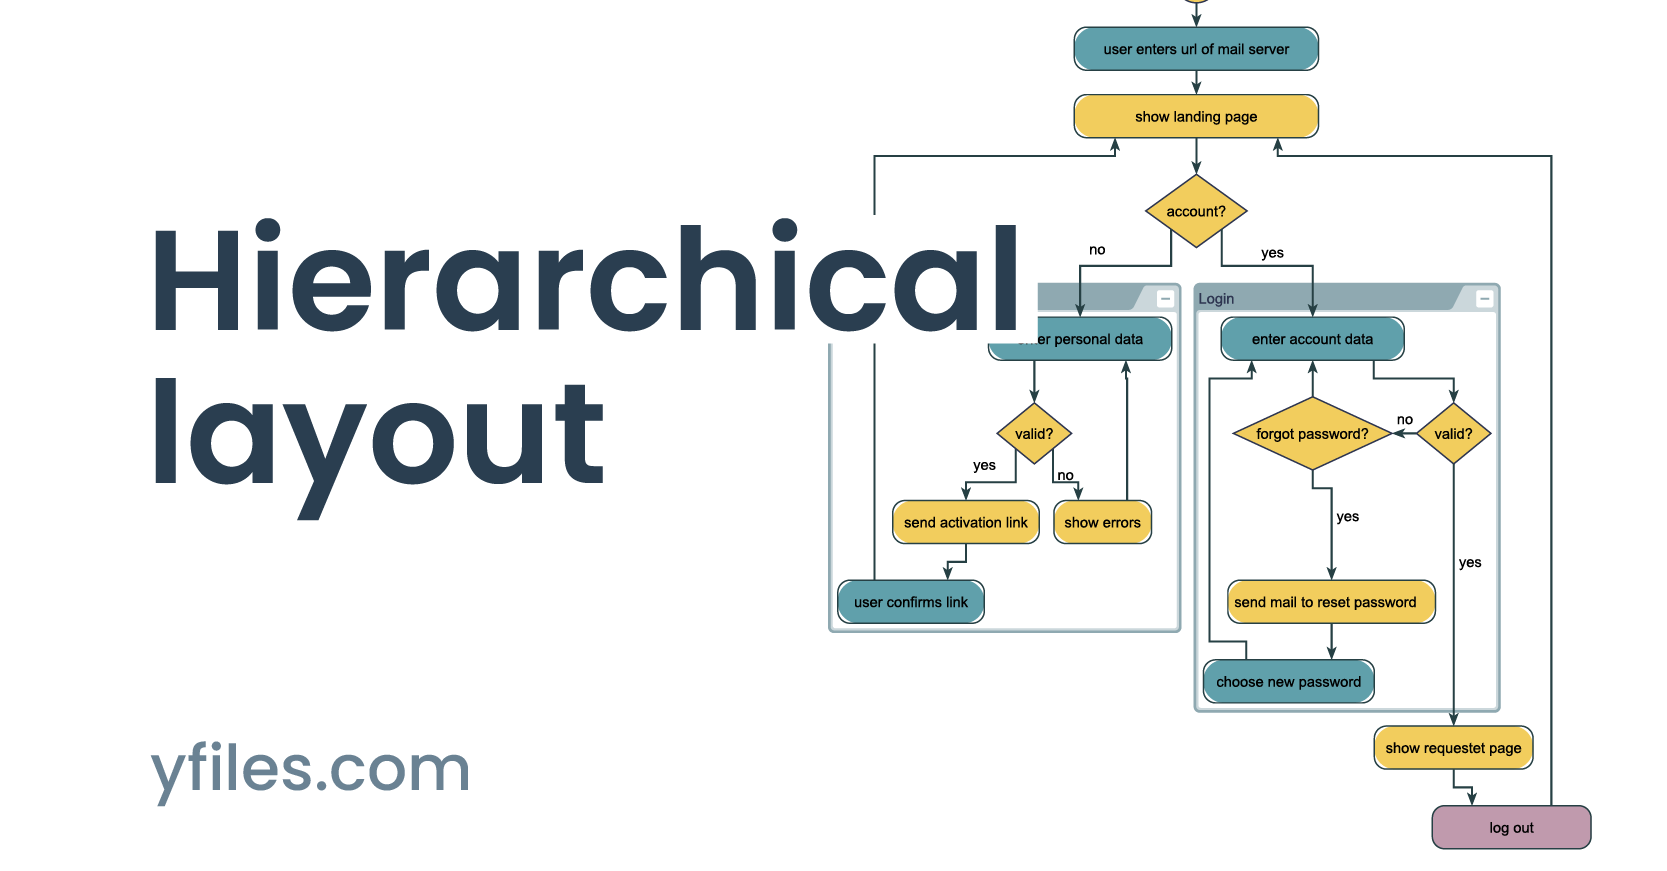
Hierarchical Layout Discover concepts, use cases, and practical customization of the hierarchical layout
The hierarchical layout stands out for its ability to organize directed graphs in an intuitive and structured way, revealing the flow and dependencies within data. It excels at visualizing flow-based diagrams (e.g., BPMN, login flows, workflows, data pipelines) with a main direction (usually top-to-bottom or left-to-right) and allows extensive customization.
In today's data-driven world, effective visualization of complex relationships and processes is essential. For developers seeking tools to automate the creation of insightful and clear diagrams, yFiles offers a suite of powerful layout algorithms.

What is a hierarchical layout?
A hierarchical layout arranges nodes in layers, with the goal of displaying a clear, directional flow, usually top-to-bottom or left-to-right. This type of layout is commonly used to visualize processes, hierarchies, and dependencies.
It's designed to show the direction of relationships clearly, making it particularly suitable for visualizing workflows, hierarchies, and complex networks of interconnected data.
The hierarchical layout in yFiles supports advanced customization, offering control over node layering, the ordering of nodes within each layer, and edge routing, making it adaptable for both simple and highly complex diagrams.

Polyline edge routing

Orthogonal edge routing

Curved edge routing

Grouped graph
Create your own hierarchical diagram application
Whether you're visualizing business processes, ownership structures, or technical workflows, yFiles lets you build stunning applications with hierarchical layouts—no manual node arrangement needed. Our advanced algorithms handle any complexity and adapt to your data and use case.
Interactive features, animations, and flexible styling ensure a great user experience, and thanks to seamless web integration, you can launch your solution on any platform.
Build your first hierarchical graph application today—for free!


Thank you!
Your message has been sent.
We'll get back to you as soon as possible.

Use cases Visualizing flow and hierarchy
Supply chain & logistic flows
Hierarchical layouts are an essential tool for supply chain visualization, enabling a clear and scalable overview of distribution steps, supplier dependencies, inventory hand-offs, transportation routes, and order fulfillment. Visualizing supply chains with yFiles uncovers bottlenecks, reduces risk, and supports regulatory compliance by easily tracing every material or product through the entire logistics network. Real-time mapping of supply chain processes helps you optimize workflows, improve transparency, and communicate complex relationships between vendors, facilities, and customers—supporting efficient supply chain management and audit readiness.
Hierarchical supply chain diagrams are invaluable for documenting, analyzing, and demonstrating compliance within global or regional supply chains. When you need to prove traceability or verify supplier integrity, a structured visualization makes regulatory or partner audits much easier and faster.
With yFiles React Supply Chain Components , you can quickly build your own interactive supply chain application—customize data sources, tailor visualizations, and integrate advanced network analysis features without having to build everything from scratch.

Business Process Model and Notation (BPMN) diagrams
Illustrating the sequence of activities in a business process, often with a left-to-right flow and swimlanes to denote responsibilities. yFiles fully supports BPMN-DI, enabling developers to effortlessly create and integrate BPMN tools into various applications. The automatic layout capabilities ensure clear and visually appealing diagrams with minimal effort.
Benefits of yFiles for BPMN include advanced customization, interactive visualization, and robust features for optimal diagramming.

Company ownership & legal entity visualization
Hierarchical layouts are the gold standard for visualizing company ownership structures and legal entity relationships. With yFiles, you can automatically generate clear entity-relationship diagrams showing corporate hierarchies, beneficial ownership, shareholding percentages, and cross-border connections. Exploring complex company trees or group structures becomes fast, interactive, and accessible—even with hundreds of entities or multi-level ownership paths.
Effective ownership visualization streamlines risk analysis, enables quick due diligence, and supports legal compliance or Anti-Money Laundering (AML) investigations. Structured diagrams make it easy to trace direct and indirect ownership, identify ultimate beneficial owners (UBO), and analyze control structures for regulatory reporting.
The yFiles React Company Ownership Components let you build custom, interactive company ownership applications in no time—integrate any data source, customize for your compliance workflow, and empower users to explore group structures or visualize corporate networks on any platform.

Flow diagrams
Representing general processes, workflows, or algorithms with a top-to-bottom or left-to-right progression. yFiles offers a specialized hierarchical layout algorithm that is ideal for visualizing flow diagrams, clearly highlighting the direction and sequence of steps.
The automatic layout minimizes edge crossings and optimizes node placement for readability. yFiles provides extensive customization options for node styles, edge routing, and labeling to create clear and effective flow diagrams.

Organization charts & reporting structures
Hierarchical layouts are the best choice for visualizing organization charts (org charts), HR structures, and reporting hierarchies. With yFiles, you can automatically create clear visualizations that map out reporting relationships, department structures, responsibility lines, and management chains. Handling hundreds or even thousands of employees or multi-level departments remains fast and interactive thanks to automatic layout and smart edge routing.
Visualizing organizational structures makes it easy to see team compositions, identify management gaps, ensure compliance with corporate policies, and support workforce planning or reorganization. Interactive org charts accelerate onboarding and give leadership and HR teams actionable insights for organizational analysis and change management.
The yFiles React Org Chart Components let you quickly build, customize, and deploy interactive organization chart applications—connect any HRIS or directory, tailor visuals for your audience, and support dynamic editing or analytics out of the box.

UML diagrams
Visualizing activity diagrams or other flow-oriented aspects of software design. yFiles is well-suited for UML diagram visualization, offering sophisticated layout algorithms that automatically arrange diagram elements for clarity.
The library supports various UML diagram types, including activity diagrams, and allows for customization of node and edge styles to adhere to UML specifications.
Benefits of using yFiles for UML include its ability to handle complex diagrams and its interactive features for dynamic exploration.

Beyond the more well-known use cases
Technical data with hierarchies
Displaying dependencies, data pipelines, or system architectures where a directional flow is inherent. yFiles' hierarchical layout excels at visualizing technical data with hierarchical relationships, clearly showing dependencies and flow.
The algorithm supports layering and sequencing constraints, allowing developers to represent complex system architectures in an organized and understandable manner.
yFiles also offers features like node alignment and edge bundling to further enhance the clarity of technical diagrams.
Almost-tree structures
Laying out data that has a primary hierarchical structure but might contain a few cross-links or cycles. While yFiles offers dedicated Tree Layout algorithms, the hierarchical layout can also effectively visualize almost-tree structures.
Its ability to handle constraints allows developers to emphasize the primary hierarchy while managing the cross-links in a visually coherent way.
yFiles' flexibility in edge routing and node placement ensures that even with non-tree edges, the overall structure remains clear.
Integration with other layouts
Combining hierarchical structures with sub-components rendered using different layout algorithms (e.g., circular, radial, and organic layouts) for enhanced visual clarity. yFiles allows for the integration of different layout algorithms within the same diagram, often through the use of group nodes.
This enables developers to highlight specific sub-structures within a larger hierarchical diagram using layouts that are best suited for those components, such as using a Circular Layout to emphasize cyclical relationships within a process step or an Organic Layout to show interconnectedness within a subsystem.
yFiles provides the tools to easily combine these different visual representations for more insightful diagrams.
The inherent ability of hierarchical layouts to emphasize directionality and levels of hierarchy makes complex information easily digestible, facilitating understanding and analysis.


Core principles of the hierarchical layout Take control of structure and clarity
The power of the yFiles hierarchical layout for clear diagram visualization stems from a set of fundamental principles that govern node arrangement and edge connections.
The process of applying a hierarchical layout in yFiles generally involves these three stages:
- Layering: Nodes are assigned to layers such that the source of an edge is preferably placed in a layer above (or before) that of the target. This reduces the number of edges pointing against the main flow direction and keeps the structure clear and intuitive.
- Sequencing: Within each layer, nodes are ordered to minimize edge crossings, improving the readability of the graph.
- Drawing (Coordinate assignment and edge routing): The algorithm determines precise node positions and routes edges intelligently, taking into account port constraints and the placement of edge labels.

Each of these steps can be fully customized. For example, you can specify that one node must appear directly above another or define relative positioning rules between nodes to reflect the logic of your data. This level of control allows you to fine-tune the layout for clarity, consistency, or specific visual storytelling.
By understanding these core concepts, developers can effectively leverage the automatic layout capabilities and fine-tune the results for optimal clarity and insight.
Layering
This initial stage organizes the nodes into distinct tiers or levels, aligning them with the primary direction of the flow you want to visualize. By default, the layout engine intelligently assigns nodes to layers based on their connections, but you can exert finer control. Custom layer constraints enable you to dictate the relative vertical or horizontal positioning of specific nodes, ensuring that certain elements always appear before or after others in the flow.
- Nodes are assigned to layers according to flow direction (top-to-bottom or left-to-right).
- Custom layer constraints allow placing specific nodes above/below others

Sequencing
Once nodes are assigned to layers, the sequencing step determines their order within each individual layer. This horizontal or vertical arrangement aims to minimize edge crossings, which can make diagrams difficult to read. While the algorithm strives for optimal sequencing automatically, you can introduce constraints to enforce a particular order of nodes on a given layer. This is useful for emphasizing a specific sequence of actions or logical grouping within a process stage.
- Nodes within a layer are ordered (left-to-right or top-to-bottom)
- Constraints can enforce custom sequences.

Edge routing
The way edges (connections between nodes) are routed has a significant impact on the clarity and overall aesthetics of a diagram. yFiles offers multiple routing styles—including orthogonal, polyline, and curved edges—to match your data and visual preferences. You can further refine your diagrams by setting minimum edge distances, adjusting edge thickness, and grouping related edges to reduce clutter and highlight logical connections. You also have precise control over the location where edges enter or leave nodes. Together, these options ensure that your diagrams remain well-structured, visually appealing, and easy to read—even for complex graphs.
- Flexible routing styles: orthogonal, polyline, or curved edges.
- Fine-grained control: adjust minimum distances, edge thickness, or group edges for bus-like routing.
- Precise control over connection points: specify sides (e.g., west, north) or exact locations where edges connect to nodes.

Integrated edge labeling
To ensure that labels on the edges don't obscure the diagram, yFiles factors them into the layout calculation from the outset. This "integrated" approach prevents labels from overlapping nodes or edge paths. You can also specify a preferred placement for labels, such as positioning them consistently on the left side of an edge, above it, or near the source or target node, along with defining the distance between the label and the edge itself for optimal readability.
- Labels are factored into layout early on — avoiding overlaps.
- Supports preferred placement, e.g., left side, above edge, or at source/target.
In essence, the hierarchical layout in yFiles achieves its structured and readable diagrams through a carefully orchestrated process involving layering, sequencing, edge routing, and integrated labeling.
These principles work in concert to minimize visual clutter, emphasize flow direction, and ensure that even complex relationships are presented in an understandable manner. Mastering these core concepts is key to unlocking the full potential of yFiles for creating superior hierarchical visualizations.

Incremental layout (also known as from-sketch mode)
The incremental layout feature in yFiles (referred to as "from-sketch mode" in the API) integrates new or modified nodes and edges into your existing diagram by adapting the layout intelligently. While the positions of unchanged elements are not guaranteed to stay fixed, the algorithm aims to retain as much of the original drawing as possible, helping to preserve context and provide stable, clear visualizations as your graph evolves.
Incremental layout is ideal for applications where changes occur dynamically or in real time, such as editing workflows, expanding trees, or visualizing live data. With yFiles, you can enable this mode to provide seamless, responsive updates as your users interact with the graph.

Concepts recap
| Concept | Meaning |
|---|---|
| Layering | Assign nodes to levels/layers in the direction of flow |
| Sequencing | Define the order of nodes within each layer |
| Edge routing | Control how edges are drawn (e.g., orthogonal with port constraints) |
| Integrated labeling | Edge labels are handled within layout phase to avoid overlaps |
| Incremental mode | Only new or changed parts of the graph are re-laid out |
Watch the full webinar episode
Watch the full episode below to gain a comprehensive understanding of hierarchic layouts in yFiles. Dr. Benjamin Niedermann walks you through the core concepts and provides practical demonstrations.
Explore more resources:

Watch the full episode below to gain a comprehensive understanding of hierarchic layouts in yFiles. Dr. Benjamin Niedermann walks you through the core concepts and provides practical demonstrations.
Explore more resources:
Interactive hierarchical layout demos
Discover a selection of interactive demos showcasing different hierarchical layout features in yFiles. Explore how various layout options help visualize complex structured data clearly and intuitively.


Step-by-step guide How to create a hierarchical layout with yFiles
Creating a hierarchical graph layout with yFiles takes just a few steps:
1. Create the network from business data
2. Make information visible
3. Improve arrangement
4. Apply different layout options

Interactive hierarchical layout playground
The Playground lets you experiment with yFiles' hierarchical layout interactively. Create, edit, and style graphs, adjust layout parameters, and see results instantly—all in one online IDE. Discover how easy it is to prototype and design graph-based applications with yFiles.
  graph.nodeDefaults.size = [70, 70];
  graph.nodeDefaults.style = new ShapeNodeStyle({
    shape: ShapeNodeShape.ELLIPSE,
    cssClass: "node",
  });

  graph.nodeDefaults.labels.style = new LabelStyle({
    shape: LabelShape.PILL,
    backgroundFill: "white",
    backgroundStroke: "1px solid #6A8293",
    font: "15px poppins",
    textFill: "#6A8293",
  });


  graph.edgeDefaults.labels.style = new LabelStyle({
    shape: LabelShape.PILL,
    backgroundFill: "#6A8293",
    backgroundStroke: "1px solid white",
    font: "15px poppins",
    textFill: "white",
  });
  graphComponent.fitGraphBounds()

Why use yFiles' hierarchical layout? Unique capabilities for hierarchical layouts you won't find in other SDKs.
While many software development kits (SDKs) can generate hierarchical layouts, only yFiles provides these game-changing advantages, like optimized performance for large graphs, and incremental layout mode:
Orientation
'left-to-right' layout orientation.

'top-to-bottom' layout orientation.
Optimized performance for large graphs
Grouping

Tabular groups

Grid-perfect positioning
Swimlanes

Buses (Grid components)

Critical paths

Layer alignment

Top-aligned layer

Center-aligned layer
Port alignment

Without port alignment

With port alignment
Edge directedness
Incremental layout mode
Before and after local change of the incremental hierarchical layout
Ideal for diagrams that demand precise alignment, distinct flow direction, and adherence to engineering or compliance requirements, yFiles' hierarchical layout removes ambiguity and streamlines complex relationships.
All of this runs efficiently on yFiles' robust engine, capable of handling thousands of nodes with smooth, real-time layout updates and animations.
Frequently Asked Questions
What is a hierarchical layout, and how does it improve diagram readability?
How does yFiles enhance hierarchical layout generation?
What are the key steps involved in a hierarchical layout process?
Can hierarchical layouts be customized with yFiles?
What are common use cases for hierarchical layouts?
Hierarchical layouts are commonly used for supply chains, company ownership structures, family trees, organization charts, BPMN process models, UML diagrams, software or IT architectures, business workflows, taxonomies and classifications, data flow visualizations, and authorization hierarchies. yFiles lets you create clear, structured, and customizable diagrams for a wide range of industries and applications.
Recap
Hierarchical layout
Hierarchical layout is a graph visualization method designed to display nodes in layered tiers, revealing directionality, flow, and dependencies in structured data. It is ideal for representing processes, workflows, entity relationships, supply chains, and technical networks where clarity and main direction are critical.
The yFiles SDK provides a powerful hierarchical layout algorithm that automatically organizes nodes into clear directional layers, minimizing edge crossings and supporting multiple routing styles. Extensive customization options let developers tailor layering, sequencing, and edge routing to create readable diagrams adapted to specific use cases and business logic. yFiles stands out for its unique selling points, such as optimized performance for large graphs, grouping, and much more. As described in core principles, yFiles supports interactive updates, integrated edge labeling, and incremental layout changes for dynamic, data-driven applications.
For implementation guidance and practical use case examples—from supply chain visualization to BPMN diagrams and organizational hierarchies—see about the layout, use cases, the section on key benefits, and the interactive step-by-step guide.
Related content
Choose your next steps
Get connected
Connect with our Customer Success Team regarding your ideas or projects.

Download yFiles
Try yFiles free of charge.
